
 Your team has worked with AD&S to develop a workflow to manage requests in your department. You’re proficient at creating and resolving tickets, adding comments, and assigning them to Someone Else. Now you’re ready to take the next step for making your team more efficient. This post is to focus on how to easily keep an eye on things on your workflow with a Dashboard.
Create a New Dashboard
When you first log into JIRA, there is a good chance that you will land on the summary page for your project (or one of your projects if you have many). There is some good general information about your project there, e.g. the Summary page describes the ticket flow and gives a stream of latest activity, the Issue page breaks the issues out into digestible chunks by assignee, issue type, criticality, and the Calendar shows any due dates on, well, a calendar. (You can export that to your Outlook, but that is a different post!)
 You might also land on the System Dashboard, which is a nice, but not always useful tool for disseminating information. It is really just a demo to get you into the world of creating your own system Dashboard. Kind of like a lightsaber, you really need to create your own. So let’s do that: From the System Dashboard (or any Dashboard) go to the top-right corner, click on the (gear) Tools drop down and Create Dashboard. Name it something that you can live with every day, “Russell’s EZ Workflow”, add a description that describes what you want out of it “A Dashboard to keep me up to date on what I am working on, what needs my attention, and what might be languishing.” Save it for now, we’ll talk about sharing later. That wasn’t so hard, yes?
Easy? Yes, useful… not yet. As you can see it is awaiting some guidance from you. If you click on the “add a new gadget” link to browse the various tools. You can add pie charts, heat maps, activity streams, and calendars. You can add these, configure them, and see if they are useful. Some of them are useful out of the box, “Assigned to Me” and “Activity Stream”. But to be really useful, you need to…
Create your Own Filter
JIRA is essentially a giant database full of all kinds of information: an issue, who asked for it, when they want it, who touched it and when, what labels have been assigned, what components does it relate to… and all of this is able to be pulled out using the JQL – Java Query Language. This is a fairly robust language for finding issues in JIRA, but we fortunately don’t have to learn it, we can just use some basic controls for finding what we need.
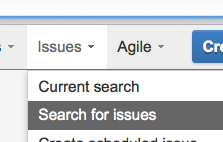 To get started, let’s click on the Issues>Search for Issues navigation at the top of the interface. This will give you a list of all the issues that you have the permission to see. This can be a large number, for me, uber-admin to the stars, that is like 18,000. Above the list of issues, we have some basic controls – like Project and Status and Assignee.
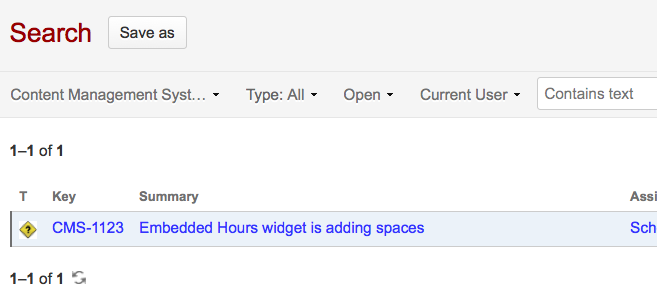 For instance if I want to view all of the CMS tickets that are assigned to the Current User that are Open, it falls quickly down to one ticket. (Sorry Dan, I’ll get right on that one!) If this is a useful list of issues, I can save it as a filter: Search>Save As.
 Now, let’s tie it all together! I click on Dashboards>Russell’s EZ Workflow and then in the right corner Add Gadget. Search for Filter Results and add it to your Dashboard. Close the Add Gadget modal and configure your widget. Select your filter, adjust the number of issues you’d like to see, and what fields. Save, and voila! you have a useful dashboard widget!
Be Creative, Share your Work
You can create a dashboard and share it with your team; include things like average ticket age, unassigned tickets in our project, list of folks with tickets assigned to them, tickets that are waiting on customer feedback. Give it a try and let us know what you think, and if you have any questions.